The Definitive Guide to Central Tendency in Python
- offpagework1datatr
- Apr 5, 2024
- 3 min read

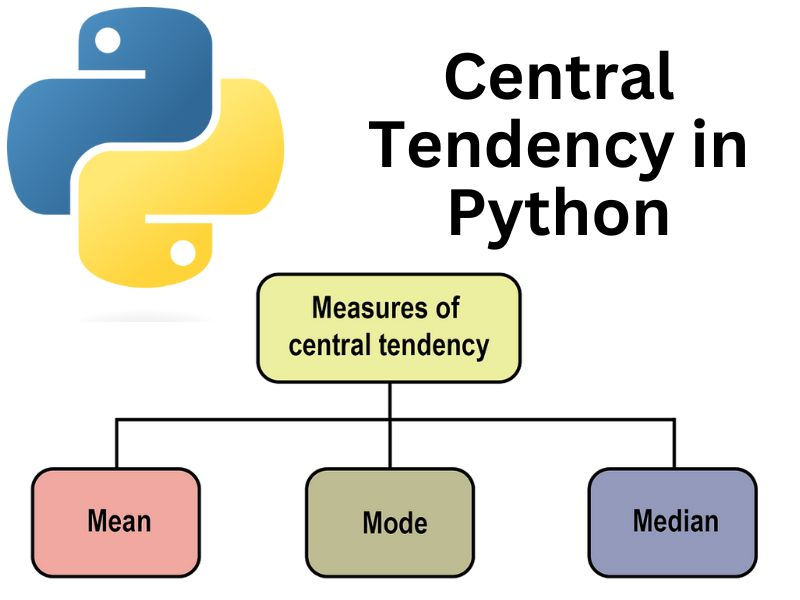
When it comes to analyzing data, one of the most important concepts to understand is central tendency. Central tendency refers to the measure that represents the center or average of a distribution. In Python, there are several methods and functions available to calculate central tendency. In this guide, we will explore the different measures of central tendency and how to implement them in Python.
Mean
The mean is perhaps the most commonly used measure of central tendency. It is calculated by summing up all the values in a dataset and dividing it by the total number of values. In Python Programming, we can calculate the mean using the mean() function from the statistics module.
import statistics
data = [1, 2, 3, 4, 5]
mean = statistics.mean(data)
print(f"The mean is: {mean}")
The output will be:
The mean is: 3
As you can see, the mean of the dataset [1, 2, 3, 4, 5] is 3.
Median
The median is another measure of central tendency that represents the middle value in a dataset. To calculate the median in Python, we can use the median() function from the statistics module.
import statistics
data = [1, 2, 3, 4, 5]
median = statistics.median(data)
print(f"The median is: {median}")
The output will be:
The median is: 3
In this case, the median is also 3, as it represents the middle value of the dataset [1, 2, 3, 4, 5].
Mode
The mode is the value that appears most frequently in a dataset. To calculate the mode in Python, we can use the mode() function from the statistics module.
import statistics
data = [1, 2, 2, 3, 4, 4, 4, 5]
mode = statistics.mode(data)
print(f"The mode is: {mode}")
The output will be:
The mode is: 4
In this example, the mode of the dataset [1, 2, 2, 3, 4, 4, 4, 5] is 4, as it appears most frequently.
Which Measure to Use?
Now that we have explored the three main measures of central tendency, you might be wondering which one to use in a given situation. The choice of measure depends on the nature of the data and the specific question you are trying to answer.
If your data is numerical and follows a normal distribution, the mean is often a good choice as it takes into account all the values in the dataset. However, if your data is skewed or contains outliers, the median might be a better representation of the central tendency.
The mode is useful when dealing with categorical or discrete data, where you want to find the most frequently occurring value.
It is important to note that these measures can be used in combination to gain a more comprehensive understanding of the data. For example, you can calculate both the mean and median to compare the average value with the middle value.
Handling Missing Values
In real-world datasets, it is common to encounter missing values. When calculating central tendency in Python, it is important to handle these missing values appropriately.
One approach is to remove any rows or elements that contain missing values before calculating the central tendency. This can be done using the dropna() function from the pandas library.
import pandas as pd
data = [1, 2, None, 4, 5]
data_series = pd.Series(data)
data_series = data_series.dropna()
mean = data_series.mean()
median = data_series.median()
mode = data_series.mode()
print(f"The mean is: {mean}")
print(f"The median is: {median}")
print(f"The mode is: {mode}")
The output will be:
The mean is: 3.0
The median is: 3.0
The mode is: 0 1.0
dtype: float64
In this example, the missing value is removed before calculating the central tendency. The mean, median, and mode are all calculated based on the remaining values.
Conclusion
Central tendency is a fundamental concept in data analysis, and Python provides several methods and functions to calculate it. In this guide, we explored the mean, median, and mode as measures of central tendency and learned how to implement them in Python. We also discussed when to use each measure and how to handle missing values.


Comments